

honestly · official-data market reports
SW1P House Prices & Property Market Report
In SW1P, the median recorded sale price across all property types is £1,000,000. Across 2079 sales in the last 120 months, 93 of them in the last year. The wider London index is -3.7% year on year.

Key takeaways for SW1P
- Median sale price: £1m
- London index: -3.7% year on year (down)
Is SW1P a good area to buy right now?
The median recorded sale price in SW1P, London is £1,000,000, based on 93 sales in the last 12 months. The wider London index is falling at -3.7% year on year.
The UK housing market in mid-2026 sits between easing mortgage rates and persistent affordability pressure. Buyers are budgeting around higher monthly costs while sellers remain anchored to peak expectations. In SW1P, the numbers tell a specific story. This report lays it out with every figure sourced from HM Land Registry sold data, live listings, and the UK House Price Index.
Want to know exactly what a property in SW1P is worth today?
Do not guess. Get a forensic, data-backed market appraisal in 60 seconds. Every comparable shown and linked to the Land Registry.
Get your free valuationSW1P house price data
Across the last 120 months, 2079 sales are on record in SW1P, a median of £1,000,000. 93 of those completed in the last 12 months. All figures are from HM Land Registry Price Paid Data, the official record of completed transactions. Asking prices from live listings are shown separately and never blended with sold figures.
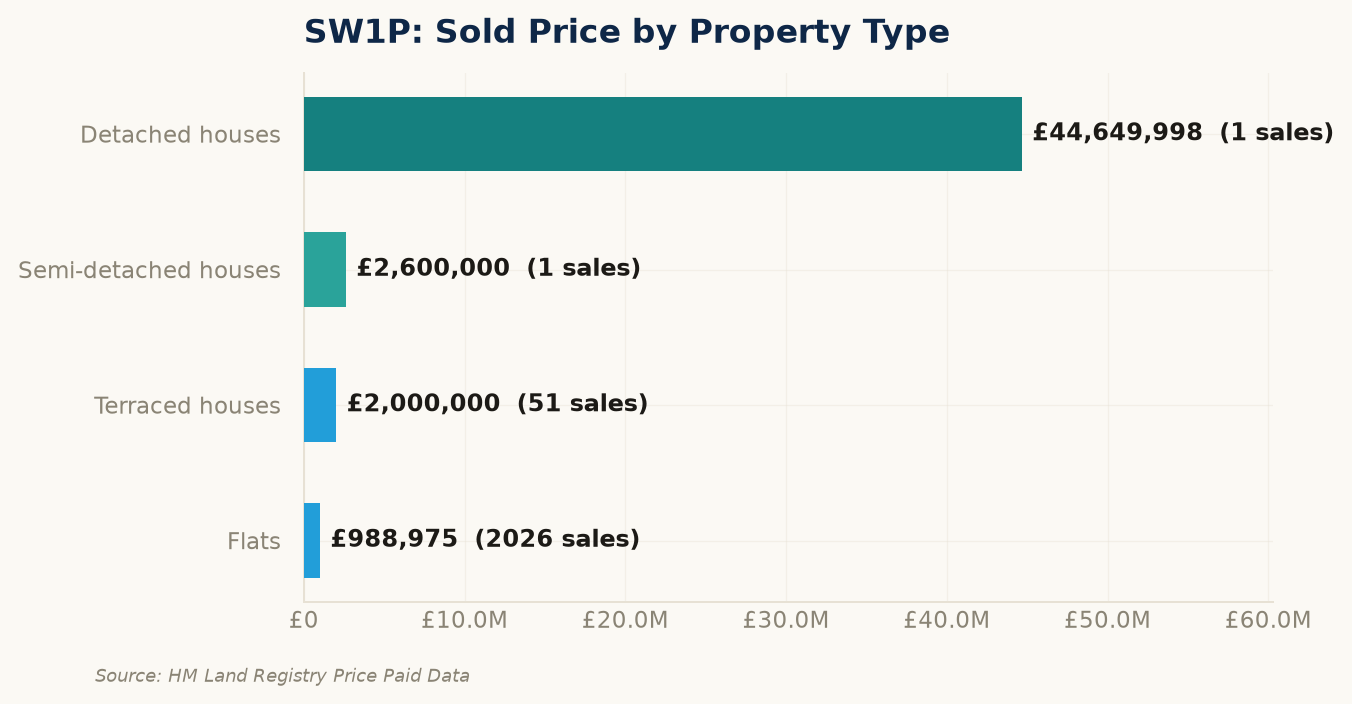
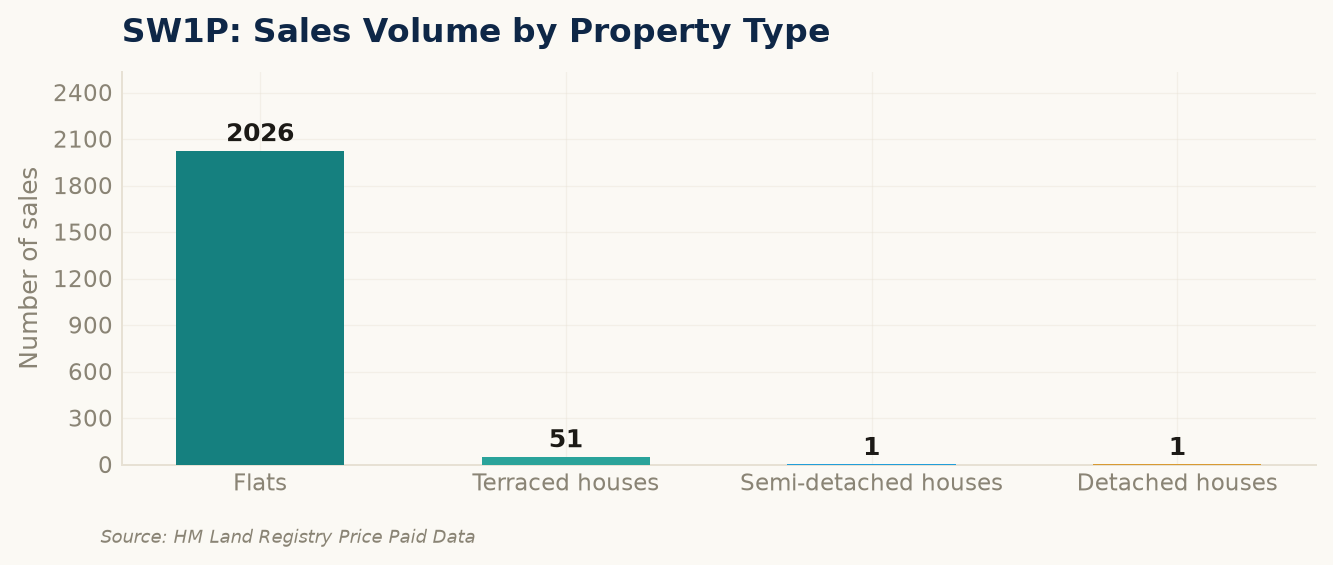
| Type | Sales | Median price | Median per sq metre |
|---|---|---|---|
| Flats | 2023 | £981,600 | - |
| Terraced houses | 54 | £2,068,000 | - |
| Semi-detached houses | 1 | £2,600,000 | - |
| Detached houses | 1 | £44,649,998 | - |
What is driving the market in SW1P?
The London House Price Index fell +3.7% in the year to 2026-05 with an average price of £544,814. This is the official mix-adjusted measure from the ONS and HM Land Registry, which controls for shifts in the types of properties sold so a rise in detached sales does not look like a rise in prices.
The Bank of England base rate sits at 4.5% as of mid-2026, down from its 5.25% peak. Mortgage rates have followed, with the best 5-year fixes now around 4.0-4.3%. Lower rates support buyer affordability, but the effect is uneven across price bands. Higher-value properties are more sensitive to rate moves because they carry larger loan-to-income multiples.
Thinking of selling? See if your property beats the postcode average
Run our strict comparable engine. It pulls the nearest sold prices, adjusts for size and condition, and shows you exactly where your home sits in the local range.
Get your free valuationWhat this means for buyers and sellers in SW1P
For buyers
- Always get an independent valuation before offering. Online estimates and agent valuations are not evidence. Sold prices are.
For sellers
- A down-valuation by the buyer's lender is the single biggest cause of fall-throughs. Set an asking price the sold comparables support and the surveyor is likely to agree. Evidence wins.
- Ensure your EPC rating and floor area are documented and visible. Buyers comparing properties filter by running costs. A missing EPC signals neglect.
Frequently asked questions
What is the average house price in SW1P?
The median recorded sale price in SW1P is £1,000,000, based on 2079 sales over the last 120 months (HM Land Registry Price Paid Data).
How much do flats and houses cost in SW1P?
In SW1P, recorded sales show flats at a median £981,600 and terraced houses at £2,068,000.
Are house prices in London rising or falling?
The UK House Price Index for London is -3.7% year on year as of 2026-05, with an average price of £544,814. This regional index is context only; it does not set the local SW1P figure.
Stop guessing. See the evidence.
Get your free, transparent property appraisal now. Every figure sourced. Every comparable shown.
Value my property on TelegramAcross the network
More The London Daily
Official statistics and further reading
Every figure on this page traces to official data. These are the primary public datasets and statutory guidance behind UK house-price reporting - go here to verify the record and dig deeper.
- Office for National Statistics - UK House Price Index, statistical bulletin
- HM Land Registry - Price Paid Data (Open Government Licence v3.0)
- HM Land Registry - UK House Price Index, search and download tool
- Office for National Statistics - House price statistics for small areas
- Bank of England - Bank Rate and monetary policy
- GOV.UK - Stamp Duty Land Tax: rates and calculator
- National Trading Standards Estate & Letting Agency Team - Material Information in property listings (Parts A, B and C)
References
- HM Land Registry. Price Paid Data and UK House Price Index (Open Government Licence v3.0). https://landregistry.data.gov.uk/ (Accessed 7 August 2026).
- Postcodes.io. Open UK postcode and geolocation data (Ordnance Survey / ONS, OGL). https://postcodes.io/ (Accessed 7 August 2026).
- Home Office / data.police.uk. Street-level crime data (Open Government Licence v3.0). https://data.police.uk/ (Accessed 7 August 2026).
- Environment Agency. Real-time flood-monitoring API: active warnings and monitored flood areas (Open Government Licence v3.0). https://environment.data.gov.uk/flood-monitoring/doc/reference (Accessed 7 August 2026).
- Open-Meteo; Copernicus Atmosphere Monitoring Service (CAMS). European air-quality index and pollutant concentrations. https://open-meteo.com/en/docs/air-quality-api (Accessed 7 August 2026).
- PlanIt (planit.org.uk). Planning application records aggregated from UK local-authority registers. https://www.planit.org.uk/ (Accessed 7 August 2026).